- The C.R.E.A.M. Report
- Posts
- The Old Epstein Files Distraction Trick...
The Old Epstein Files Distraction Trick...
The Margin That Could Crash The Market, While You Were Looking the Other Away...
Kevin Davis
February 17, 2026

Above Average Info For The Average Joe…
WHEN INVESTING BECOMES A LIFESTYLE YOU WEAR IT!
NEW MERCH ALERT - WEALTHY RED - Limited Quantities - Grab Yours Today! CLICK HERE

WEALTHY RED…

AskiDojo — Where Institutional Intelligence Meets Main Street.
There’s a moment every retail investor knows all too well. The bell rings, the market opens — and suddenly your position swings 4% like it’s caught in a storm. You scramble: flipping tabs, scanning headlines, refreshing Twitter, desperate to understand why.
But by the time you piece it together, it’s over. The move’s been made. The institutions — the ones who always seem to know first — already acted while you were still searching for answers.
That imbalance, that information gap… it’s been the law of the market for decades.
Until now.
AskiDojo isn’t another stock website slapping shiny charts on the same old data. It’s the first platform that actually goes after Wall Street’s information edge — giving you the same real-time signals they trade on, and the receipts to back it up.
🔍 The Movement Explanation Engine
Here’s what last week could have looked like for AskiDojo users watching AVGO:
The stock ripped +4.2% in a single session. In a world where AskiDojo was live, the Movement Explanation Engine would have done the heavy lifting for you in seconds — stitching together the catalyst from a TSMC capacity update, the broader AI supply-chain repricing, and clear signs of institutional accumulation and unusual volume in the prior three sessions. No scrolling. No tab-hopping. No wading through “according to analysts…” — just a clean, real-time read on what likely moved the stock and why it mattered
This isn’t a news feed. It’s a cause-and-effect engine. Every move gets taken apart — earnings revisions, unusual options flow, sector rotation signals, macro policy shifts — then rebuilt into plain language and pushed to you before you’ve finished your morning coffee.
For every stock. Every day. Automatically.
📊 Predictions With a Track Record You Can Verify
Here’s what really sets AskiDojo apart: accountability that you can actually see.
Our Beat Odds™ and Guidance Raise™ signals don’t just whisper what might happen into your ear before earnings — they walk you through the math. Historical beat rates, estimate drift, options and institutional positioning, revenue momentum trends — all laid out. Every call is timestamped, tracked, and graded against what actually happened, so over time you know exactly what you can trust and how to use it.
No “trust us.” No fuzzy conviction scores. No quietly disappearing the calls that missed.
When we say a stock has an 84% chance of beating earnings, you can see the full logic behind it — and after the print, you can see exactly how it played out. That kind of radical, receipts-first transparency isn’t a marketing angle most platforms push, because most platforms wouldn’t survive it.
🏛️ The Economic Command Center
Wall Street isn’t powerful because it knows more — it’s powerful because it sees more, sooner.
The Economic Command Center is built to put that same X-ray vision in your hands. Instead of staring at a flickering price chart, you’re watching the machinery behind it: yield curves bending, credit spreads snapping wider, currencies repositioning, margin and liquidity tightening or flooding in.
You’re not guessing how the market “feels.” You’re watching the stress build in credit, the VIX term structure hint at a regime shift, Japanese Government Bond yields flirt with levels that can yank the global carry trade inside out — all from a single screen.
It’s the difference between driving in a storm and sitting in the control tower, watching every instrument in real time — and knowing exactly when to step on the gas, ease off risk, or get out of the way.
The Economic Command Center pulls together institutional‑grade macro signals — from sector rotation and liquidity shifts to early‑warning stress indicators — and translates them into clear, position-level insight. Instead of dumping data when credit spreads widen and leverage runs hot, it tells you, in plain English, what happened the last few times this exact pattern showed up and how markets behaved afterward.
It’s the kind of context that used to live behind Bloomberg terminals and five‑figure research packages — the stuff you needed a Series 7 and a seat on a desk to even access. Now it’s designed to sit on your screen, working for you.
🎓 Learn While You Research (The Real Moat)
Every platform throws data at you. Almost none teach you how to think with it.
AskiDojo’s Learn Mode is wired straight into the research itself. Hover over a yield curve inversion and you don’t just get a number — you get what an inversion actually is, why traders obsess over it, what’s happened in past cycles when it showed up, and how institutional desks are positioning around it. Not in a separate explainer. Not buried in a course. Right on the screen, in the exact moment you’re making a decision.
Family Mode pushes that even further. It translates institutional-grade thinking into language a 7th grader can follow — without sanding off the nuance. Your teenager can see why rising Credit Default Swap spreads might spell trouble for bank stocks. Your spouse can follow why a shift in the Fed’s dot plot could change what you pay on your mortgage.
Financial literacy shouldn’t be locked behind a Bloomberg terminal or an MBA. It should sneak up on you — happening naturally, every time you open your research.
🤖 The Master Research Engine™
While you sleep, AskiDojo’s research engines are doing the obsessive work a human never would — combing through thousands of stocks across five institutional lenses: earnings consistency, free cash flow growth, balance sheet quality, momentum, and technical structure. You wake up and it’s all there: scored, ranked, and framed in context, before you’ve even touched your first coffee.
This isn’t a lazy watchlist or a dumb signal dump. Each name comes with a composite “how would a pro desk see this?” score, market cap tag, and the exact metrics that lit it up. It’s the kind of cross-dimensional engine hedge funds spend years and millions building in-house — and you get to coast on the output without hiring a quant, spinning up infrastructure, writing a single line of code or financially losing and arm or leg.
🌍 Global Market Intelligence, Decoded
Most people pick stocks from headlines, hot takes, or whatever’s trending in their feed. You’re not going to do that.
With AskiDojo, every stock idea starts with signals — not stories. When the Bank of Japan tweaks policy at 2 AM Eastern, you’re not “finding out later”; you’re immediately seeing which sectors just flipped risk regimes, which themes got stronger or weaker, and which specific U.S. stocks just moved from “ignore” to “potential setup.”
You’re no longer asking, “What should I buy?” You’re asking, “Given these signals, which stocks are set up to win?” — and the platform hands you a curated, battle-tested list instead of a rumor mill.
When something matters, you'll know. When it doesn't, you won't be distracted by noise.
The information edge institutions have enjoyed for decades was never just about having data — it was about turning that data into decisions faster than anyone else. The ability to see a TSMC capacity shift, link it to a semiconductor’s move, catch the options flow confirming it, and adjust a portfolio before the headline even lands.
That kind of synthesis is no longer reserved for trading floors and five‑figure terminals. It’s not hiding behind a $25,000 subscription, a three‑day‑late research note, or a Discord room spamming rocket emojis.
It’s on your screen, waiting for you to type a ticker.
The institutions were never inherently smarter than you. They just had better tools.
Now you do too.
AskiDojo — Where Institutional Intelligence Meets Main Street.
AskiDojo is an educational and analytical platform. All signals, predictions, and analyses are for informational purposes only and do not constitute financial advice. Past performance does not guarantee future results.

Margin Bridge Is Falling Down…
Nothing to See! Here Just Another Episode Of Margin Jenga!..
What if the market hasn’t been “resilient” at all – what if it’s been screaming the truth the whole time, and the truth is that everyone is already all‑in with no chips left to buy the dip or stop the bleeding?
What if this was the plan all along?
What if the secret file nobody wanted you to open is simple: margin at record highs, cash at record lows, and a structure so leveraged that when it tips, nobody can catch it – they can only dump it. FINRA’s own statistics show margin debt sitting around 1.23 trillion dollars as of December 2025, up roughly 36% from a year earlier and the highest in history. That isn’t a warning light; that’s the entire dashboard on fire.
Now lay that over the Bank of America fund manager surveys: global managers have slashed cash to a record‑low 3.2–3.3%, the lowest levels in the history of the survey, while equity allocations are back near multi‑year highs. The people supposedly managing risk have basically admitted, in writing, that they’re sitting almost fully invested, with no dry powder and no real hedge. If the scale finally tips, they can’t buy the dip; they are the dip.
What if the market has been telling you exactly this – not in headlines, but in the positioning data – and the only reason it feels “fine” is because nobody has tried to exit the burning theater yet?
The cashless crowd at the edge of the cliff
Very low cash levels don’t mean confidence; they mean captivity. BofA’s January and December surveys show managers at “hyper‑bull” sentiment, with cash at record lows and hedging activity collapsing. When the people running hundreds of billions are all on the same side of the boat, risk doesn’t disappear – it just concentrates.
If you believe the numbers, the institutional crowd has boxed itself into a corner: elevated equity exposure, minimal cash, and an implicit promise to clients that they’re “fully participating” in the upside. But that means when selling starts, they don’t get to nibble; they have to sell something, anything, just to raise liquidity.
The “what if” here is brutal: what if the next correction isn’t buyers stepping back, but forced sellers tripping over each other in a cashless stampede?
Margin debt at fresh records and managers out of cash is not an accident; it’s a system optimized for performance optics, not survival. You’re not looking at a safety net. You’re looking at a trapdoor.
What if 0DTE is the detonator?
Now plug in the 0DTE options complex – the one‑day, zero‑day contracts that turned the market into a day‑trading arcade. In 2025, roughly 2.3 million SPX 0DTE contracts traded per day, making up around 59–60% of all SPX options volume.
That means most of the index options market is now a same‑day bet, with extreme gamma and relentless dealer hedging.
0DTE options concentrate volatility into tiny windows: small moves in the index force dealers to buy or sell aggressively to hedge, which can turn a routine dip into a sudden air pocket. The VIX, tuned to 30‑day implied volatility, barely flinches, so the official “fear gauge” stays numb while intraday reality looks like a seizure.
What if that’s the punchline – that the metric we still quote on TV literally can’t see the thing that’s driving the chaos?
During stress episodes, analysis of April 2025 showed 0DTE flows magnifying intraday selloffs as market makers adjusted hedges into a falling tape. Now imagine that happening when margin is maxed, fund managers are out of cash, and the first wave of selling hits. What if 0DTE is not the cause of the collapse, just the detonator that ensures everyone goes down together?
Margin: the accelerant hiding in plain sight
The margin data reads like a confession. FINRA figures show U.S. margin debt blowing through prior peaks, topping 1.06 trillion in August 2025, then continuing higher into the 1.2 trillion range by year‑end. Historical commentary is chillingly consistent: “every spike like this has ended in market turmoil.” It’s not subtle.
From mid‑2024 to late 2025, balances climbed from around 800–900 billion to over 1.2 trillion, a surge of more than a third in just 12 months. That’s not incremental leverage; that’s the street flooring the accelerator on borrowed money. The correlation to equity highs isn’t a coincidence – margin isn’t just “fueling the climb,” it’s guaranteeing that the descent, when it comes, isn’t a gentle slide but an avalanche.
What if the “secret” the market’s been broadcasting is this: prices went up because credit did, and when credit reverses, prices won’t just drift – they’ll gap.
Leveraged ETFs and the illusion of control
Then there’s the chemical cocktail of leveraged ETFs – 2x and 3x products that reset daily and mechanically buy high and sell low. In calm conditions, they feel like genius: triple the upside on your favorite index or theme. In real stress, they become forced‑flow machines that must dump into weakness and chase into strength, compounding intraday swings.
Overlay margin on top of that and you have leverage on leverage – a structure where something like a 5–7% hit in a triple‑levered growth or tech product isn’t just a bad day, it’s a signal for algorithms and risk systems to cut exposure elsewhere. What if the market’s bizarre “everything moves at once” behavior isn’t random at all, but the predictable outcome of thousands of these leveraged, auto‑rebalancing products breathing in sync?
In that world, the notion of “fundamentals” stabilizing prices becomes a fairy tale. The flows are the fundamentals. And the flows are wired directly into the margin and derivatives complex.
The rotation that gives the game away
Here’s the last “what if” that should keep you up at night: what if the quiet rotation into utilities and consumer staples – the traditional defensive sectors – is actually the smart money’s way of screaming without moving their lips?
Recent outlooks show renewed inflows and overweight stances in these safety buckets while speculative growth leadership has started to fray.
At the same time, BNY and other institutional commentaries flag that investors are preparing for more volatile conditions even as headline indices sit near highs. The surface narrative is “soft landing,” “AI boom,” “earnings resilience.” The positioning narrative is: “I’m not allowed to go to cash, so I’m hiding where the bodies usually fall last.”
What if the market has been telling you the real story in the only language it has – leverage statistics, cash levels, derivatives flows, sector rotation – and the story is that there is no firewall when this goes wrong, only forced sellers and margin clerks?
Because in a world where margin debt is at records, 0DTE dominates the options tape, fund managers sit with the lowest cash on record, and defensive sectors quietly gain favor, the real black swan isn’t something we can’t see. It’s something we refuse to believe: that the collapse isn’t an event out of nowhere – it’s the logical conclusion of the data everyone has already read.
WHEN INVESTING BECOMES A LIFESTYLE YOU WEAR IT!
NEW MERCH ALERT - BILL GATES BLACK - Limited Quantities - Grab Yours Today! CLICK HERE

Bill Gates Black
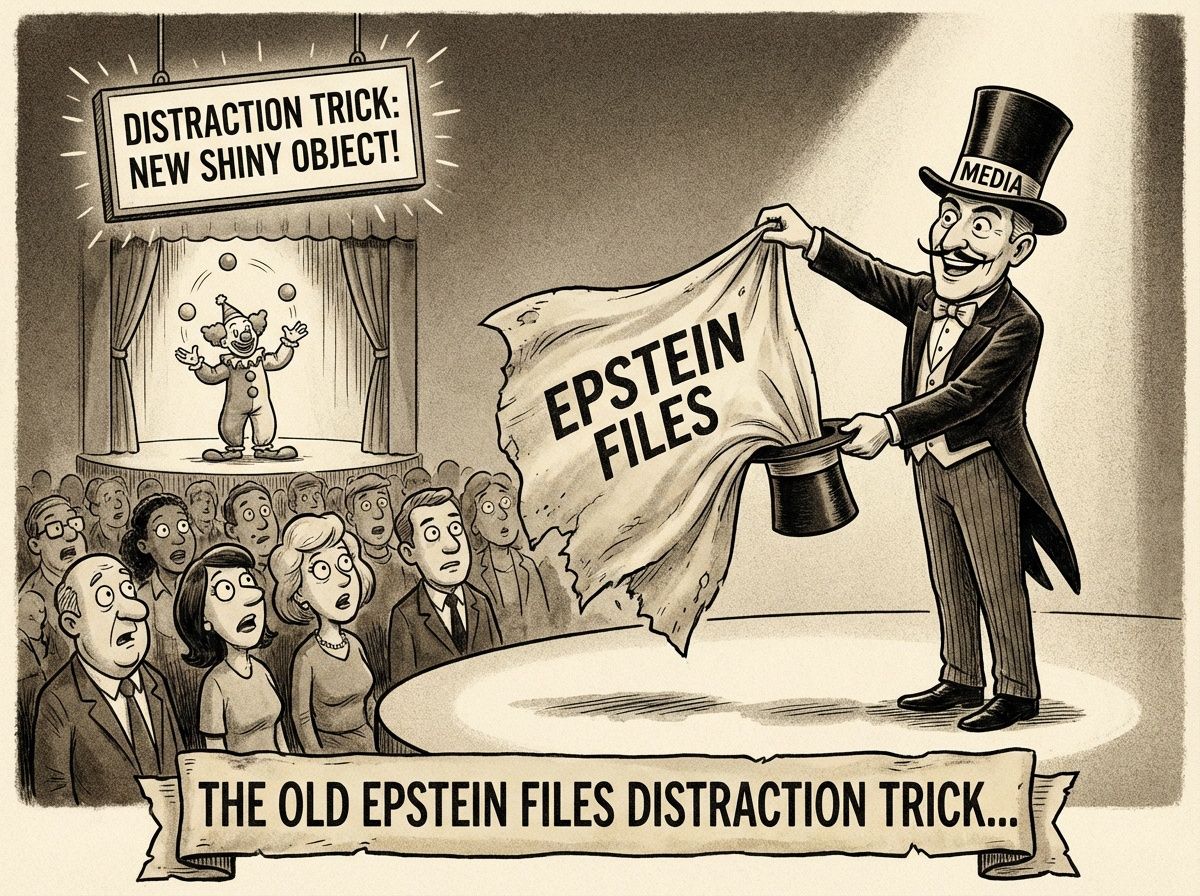
The Old Epstein Files Distraction Trick…
Wall Street loves a good scandal almost as much as it loves a good spread, and the Epstein files are the perfect circus for a market that does not want you looking at the balance sheet of the system itself.
While everyone doom-scrolls 3 million pages of depravity and flight logs, the biggest white-collar wealth transfer of the century is unfolding in broad daylight, hidden under the friendliest label in finance: “market rotation.”
The perfect distraction file
The Epstein archive is tailor‑made distraction content: powerful names, sex, blackmail, “hidden files,” and a never‑ending drip of revelations. It hits every dopamine receptor that CNBC and social feeds need to keep eyeballs glued while the real crime happens in the term structure and the leverage data.
Instead of talking about how the financial system has quietly rebuilt record customer margin debt, pundits get to gesture at “accountability” because some VIP got outed in a PDF. Instead of asking why regulators let leverage soar faster than GDP, the national conversation is about who was on which jet in the 1990s.
It’s the oldest play in the political‑Wall Street playbook: when the money risk is systemic, change the topic to something morally radioactive.
The genius of this distraction is that it feels like truth‑telling. The public gets the illusion of transparency—“millions of pages released,” “the files are finally open”—while nobody asks the more dangerous question: who is levered to whom right now.
While the country argues about redactions, the margin statistics read like a heart monitor on a patient sprinting toward cardiac arrest. FINRA’s own numbers show investor margin debt around 1.23 trillion dollars as of December 2025, up roughly 36 percent in a year. That is not “normal risk appetite”; that is the entire market standing on a chair to grab one more basis point of performance.
Look at that curve: from roughly 900 billion at the end of 2024 to over 1.22 trillion a year later, climbing almost every month. The last time the debt line went vertical like this, we did not call it “healthy rotation”; we called it “late cycle,” “froth,” and then “please bail us out.” Yet this time, the narrative is that everything you’re seeing is just money “rotating” from one sector to another, as if the total risk in the system hadn’t been quietly levered up.
Rotation is a comforting fairy tale: capital just “moves,” winners turn to laggards, valuations “rebalance.” In reality, when leverage grows this fast, rotation looks more like hot money slamming through narrow sector doors while the fire marshal is conveniently looking at a sex‑crime file dump.
The theft isn’t a guy in a hoodie hacking an exchange; it’s legal, papered, and blessed. It’s:
• Cheap leverage for institutions while retail faces higher borrowing costs.
• Structured products that socialize downside and privatize upside.
• Fee stacks and spread games on top of borrowed money the public ultimately backstops.
The Department of Justice is bragging about record fraud recoveries and big‑ticket cases, which makes a great headline. But those numbers are rounding errors compared with the not‑technically‑illegal wealth siphon that happens when a trillion‑plus in margin is layered onto an already financialized economy. We celebrate a few hundred million clawed back from some brazen scam while trillions sit on the edge of a deleveraging cliff.
Every cycle, the script is the same: leverage builds, products get more exotic, disclosures get thicker and less readable, and someone somewhere promises that “risk is better distributed now.”
Translation: when this goes wrong, it will hit pensions, index funds, and passive investors who never read a term sheet but were told that markets always go up over time.
The obvious market nobody wants to see
From 30,000 feet, the market looks “obvious”: dispersion, factor rotations, flows chasing whatever fits the macro story of the week.
Underneath, it looks like a coiled spring, because:
• Margin debt has ripped to new records in a very short time.
• Risk assets keep levitating as if funding is infinite.
• Volatility is periodically crushed, rewarding short‑term bravado.
If you believe in physics, a system under tension eventually releases that energy. The only unknowns are the trigger and the path. Maybe it’s a funding squeeze, a blow‑up in some “safe” credit product, or a sudden loss of confidence in one of the too‑interconnected-to-fail platforms.
Whatever it is, the spring is already wound. The selling won’t be philosophical; it will be mechanical, forced, and fast.
The street will call it an “unforeseen shock.” The data will call it what it was all along: the logical outcome of stacking 1.2 trillion dollars of margin on top of a financial system that prefers stories to statistics.
So you get three rings, all under the same tent:
• Ring one: The Epstein files, a million‑page morality play designed to look like institutional reckoning.
• Ring two: Official fraud busts and “record enforcement years” that imply someone is actually minding the store.
• Ring three: A structurally levered market, where legal white‑collar extraction dwarfs the headline scandals and will only be called “fraud” retroactively, after it blows up.
The public stares at ring one, applauds ring two, and barely notices ring three until the tent pole snaps.
When that coiled spring finally goes, everyone will swear it was impossible to see. But the files that mattered weren’t sitting in some sealed evidence room. They were posted in plain English on a regulator’s website, in a boring table labeled “Margin Statistics,” waiting for someone to realize that the real scandal wasn’t who flew where—it was who levered what.
WHEN INVESTING BECOMES A LIFESTYLE YOU WEAR IT!
NEW MERCH ALERT - BUY THE DIP NAVY - Limited Quantities - Grab Yours Today! CLICK HERE

BUY THE DIP NAVY…
Thank you for reading, we appreciate your feedback—sharing is caring.
Reply