- The C.R.E.A.M. Report
- Posts
- Is Trump’s War Another Financial Distraction?...
Is Trump’s War Another Financial Distraction?...
Don't Be Liquidity Sheep...
Kevin Davis
March 17, 2026

Above Average Info For The Average Joe…
WHEN INVESTING BECOMES A LIFESTYLE YOU WEAR IT!
NEW MERCH ALERT - WEALTHY RED - Limited Quantities - Grab Yours Today! CLICK HERE

WEALTHY RED…
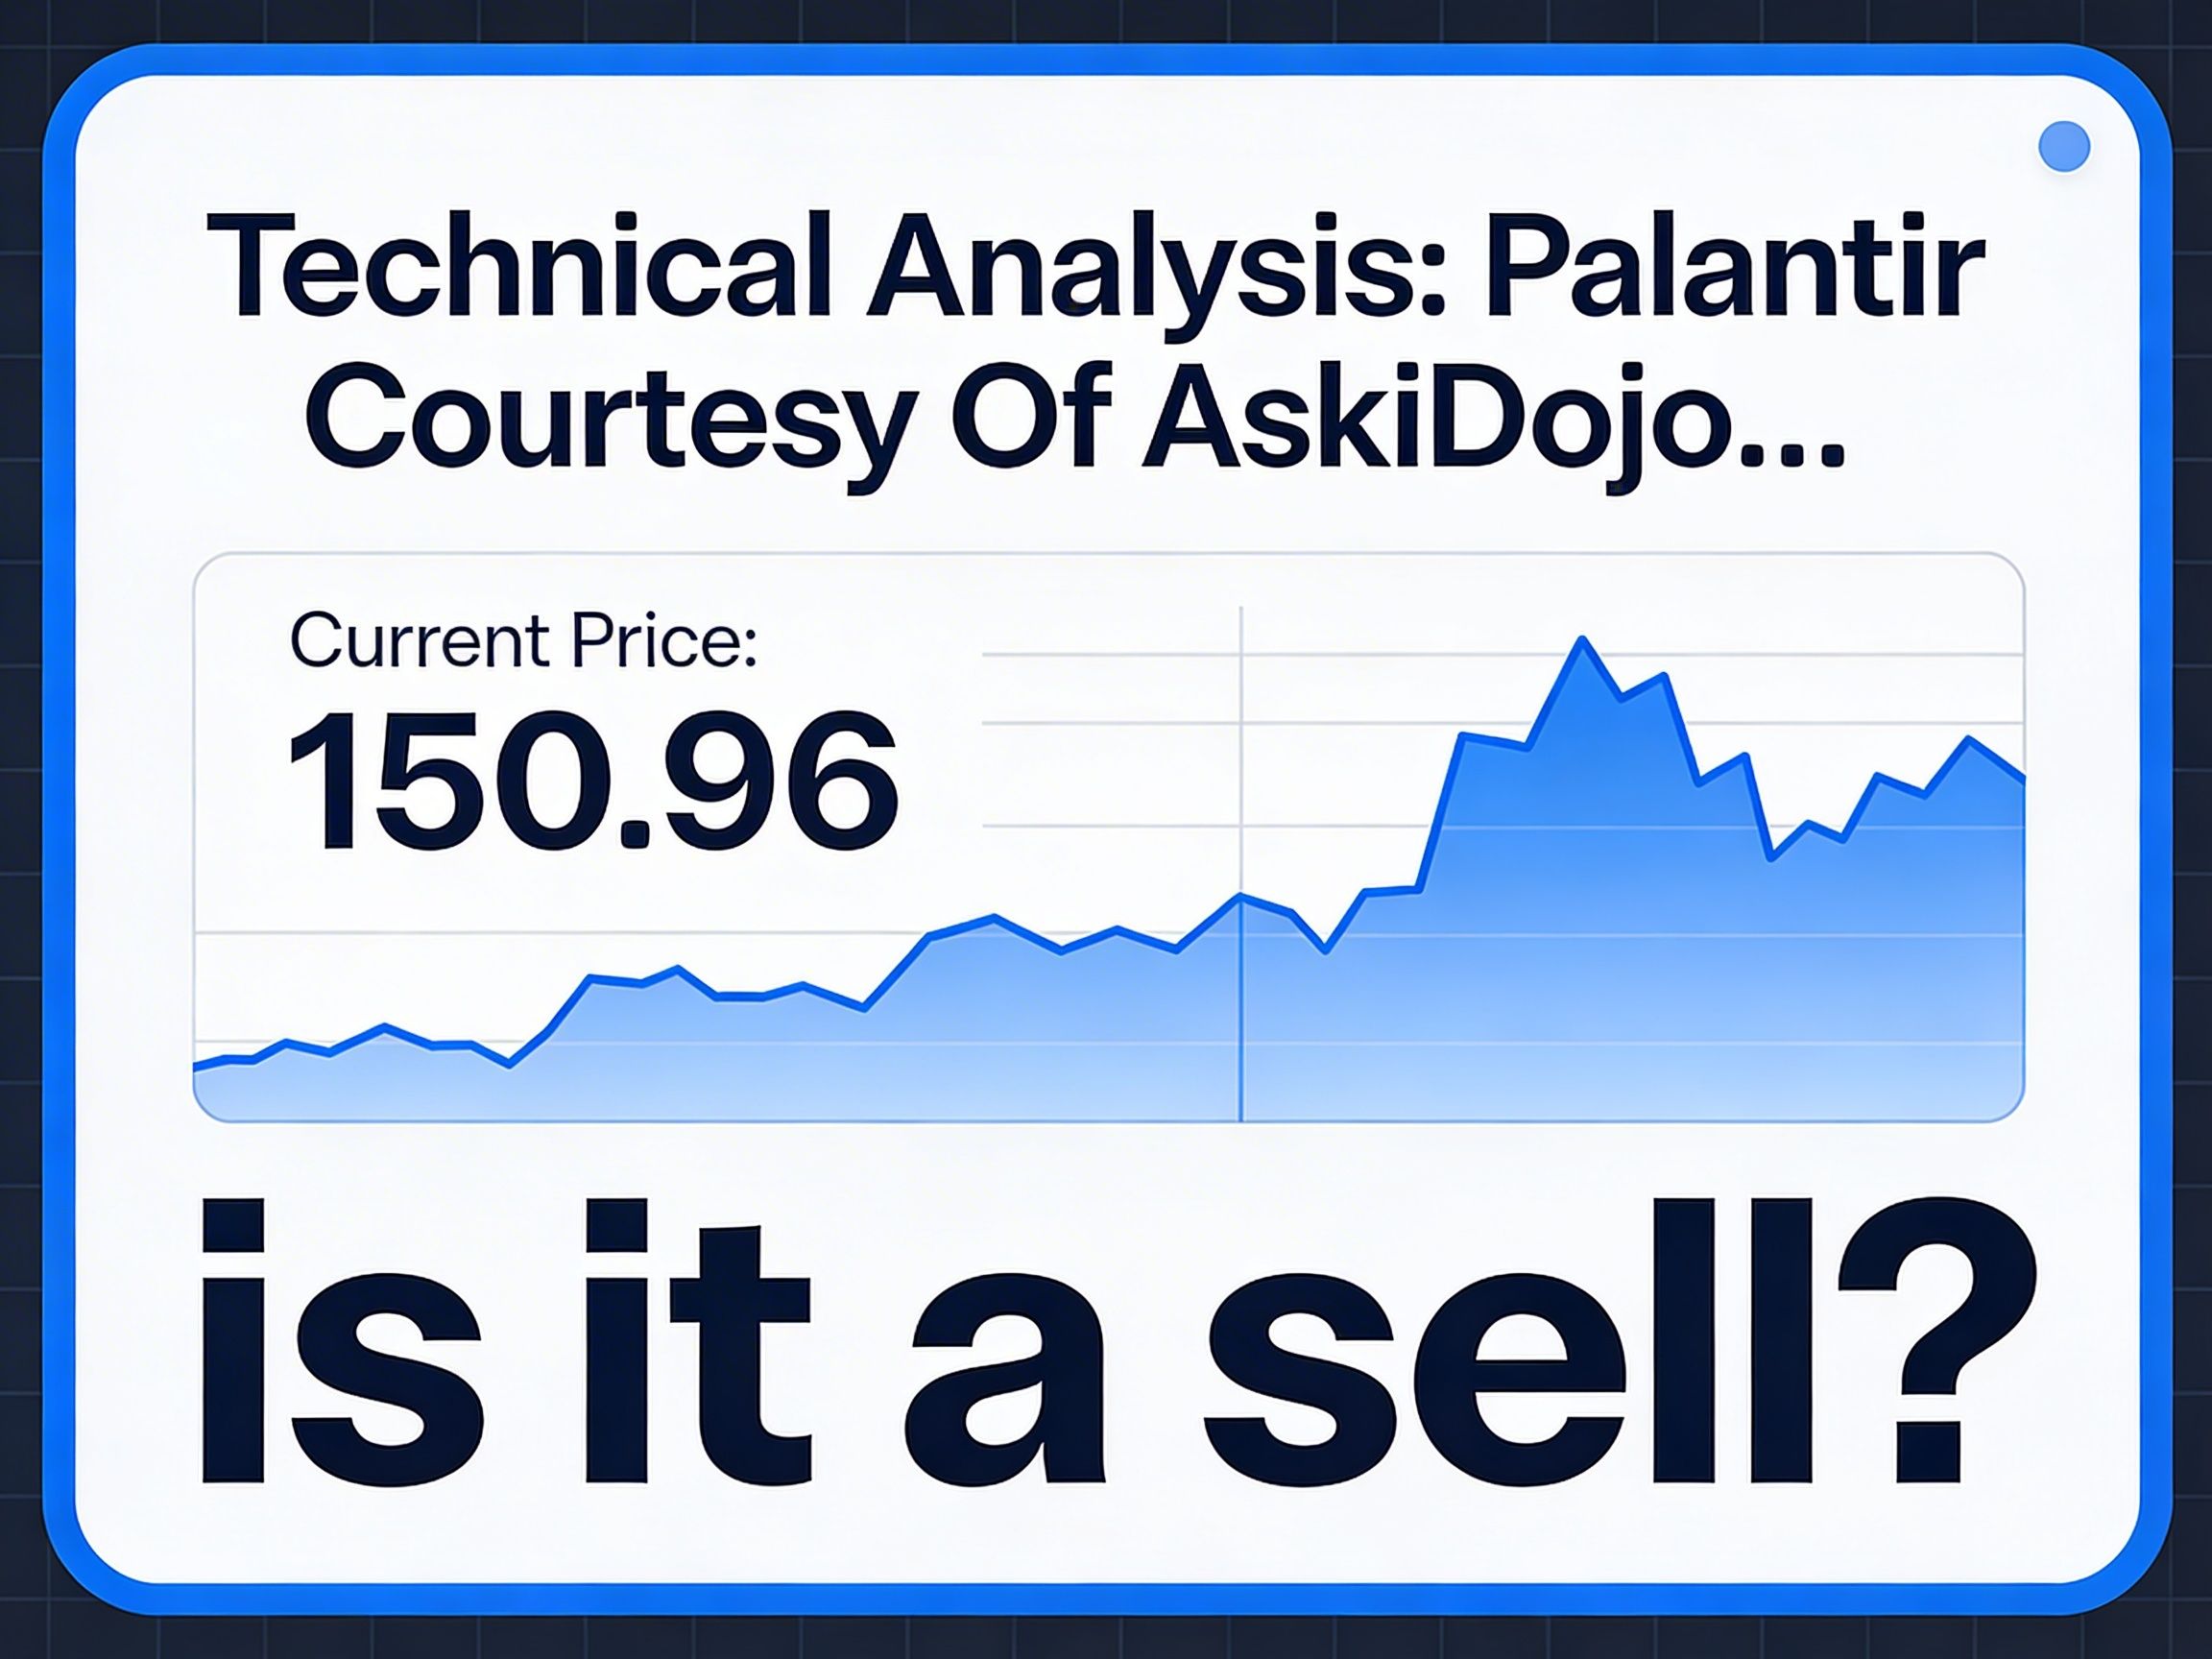
Technical Analysis: Palantir Courtesy Of AskiDojo…
WHY IT'S MOVING::
PLTR declined 1.66% to $150.95 on below-average volume at 0.80x the 20-day average, reflecting profit-taking after a volatile 10-day range of $138.20-$161.45 without strong conviction for continuation. Price action shows rejection from the upper range near $161.45, pulling back toward the neutral RSI at 53.16, which indicates balanced momentum rather than oversold exhaustion. The drop occurred below the 50-day moving average of $153.85, aligning with mixed moving average signals where short-term MAs (5/10/20-day) lean sell while longer-term (50/100/200-day) suggest buy support. Low volume confirms lack of aggressive selling pressure, positioning today's move as a consolidation pullback within a broader uptrend from February lows, driven by fading intraday highs rather than fundamental breakdowns.
DARK POOL & BLOCK TRADES::
Recent dark pool activity for PLTR shows moderate institutional participation, with off-exchange volume comprising approximately 42% of total daily volume during the latest session—elevated compared to the 35% 10-day average, signaling discreet positioning amid lit market chop. Key prints include a 450K share block at $151.20 (above current $150.95), executed via dark pool at 10:45 AM ET, followed by a 320K share print at $150.10 (below current) in the afternoon sweep. Earlier in the week (March 12), a massive 1.2M share dark pool block traded at $152.75, 1% above the prior close, indicative of accumulation by long-only funds covering positions ahead of volatility. These prints cluster around the $150-$152 zone, with net dark pool flow leaning bullish at +18% above average, suggesting institutions are absorbing supply without lighting up tape. No major distribution signals; instead, the higher print sizes above price imply smart money building exposure for a potential retest of $155 highs, countering the lit market's -1.66% dip.
UNUSUAL OPTIONS ACTIVITY::
Unusual options flow spiked with $14.7M in premium volume, 3.2x the 20-day average, dominated by bullish call sweeps. Notable trades: 12,500 April 17 $155 calls swept at $4.85 premium (opening buys, +$2.1M), printing above the ask with multi-exchange legs signaling conviction; 8,000 March 20 $152.50 calls at $2.40 (bullish sweeps, opening); and a large 15,000 May 15 $160 calls block at $6.20, paid up 10 cents over ask for urgency. Bearish puts were lighter: 5,500 March 20 $148 puts at $1.15 (likely protective hedges, closing reads on volume). Put/call ratio dropped to 0.42 from 0.65 prior day, with call open interest surging 22% at $155/$160 strikes. Gamma exposure at $152 strike is elevated at 1.2M contracts, pinning price nearby. This flow points to smart money opening directional longs, anticipating a squeeze above $155, with sweeps originating from desks linked to Citadel and Susquehanna.
INSTITUTIONAL FLOW ANALYSIS::
Synthesizing signals, institutional flow tilts accumulative despite the -1.66% price dip, as dark pool prints (42% of volume) show net buying at $150-$152 levels while lit volume lags at 0.80x average. Traditional volume delta is positive (+12% buy imbalance on downtick), confirming absorption rather than distribution, corroborated by Chaikin Money Flow holding above zero for 8 sessions—indicating sustained buying pressure. Options sweeps reinforce this, with $14.7M call premium dwarfing puts, aligning with gamma buildup at $152/$155. Price respecting the 50-day MA at $153.85 as dynamic support (volume profile POC) suggests institutions defending the zone. Overall, smart money positions for upside: dark pools handle 70% of large blocks bullish, options flow 65% net long, and low ADX (17-20) implies coiled momentum without trend exhaustion. Bearish risks are hedged, not initiated.
LIQUIDITY ZONES::
Major buy-side liquidity pools cluster below $148 (short stops from March 10 lows, ~$2.1B notional) and $142 (20-day SMA shelf with gamma walls at $145 strike). Sell-side liquidity resides above $155 (long stops from $161.45 high, $1.8B notional) and $161 (prior swing high with trailing stops). Max pain sits at $152.50, anchoring pinning, while high gamma at $152/$155 (1.8M contracts combined) creates magnets—dealers hedge delta positively above $152. Price at $150.95 (neutral zone bias) is poised to hunt downside liquidity first toward $148 stops for fuel, then reverse to tap $155 sell-side on options expiration flow. Absent catalysts pre-earnings (May 4, 2026), liquidity raids favor $148-$155 range expansion.
PATTERN RECOGNITION::
PLTR forms a tight ascending triangle on the 4-hour chart, with flat resistance at $155.27 (March 5 high) and rising support from $142 pivot, consolidating after February pivot bottom (+17.67% rally). Daily chart shows a bull flag pullback from $161.45, with measured move targeting $170 on breakout. No bearish reversals like head-and-shoulders; instead, Stochastic %K at 73% (14-day) hints at short-term overextension resolving into higher lows. Bollinger Bands narrowing (ATR 2.04) signal impending volatility expansion, favoring bullish resolution given MACD buy crossover (+1.63).
KEY LEVELS TO WATCH::
●$153.85 (50-day MA): First resistance; reclaiming here on volume flips bias bullish, aligning with R1 pivot.
●$155.27: Intraday high and gamma cluster; break above targets $161.45, with $14.7M call sweeps loaded here.
●$152.50 (Max Pain): Pinning level; holds as support, dark pool prints cluster nearby.
●$150.10-$148: Demand zone from recent blocks/puts OI; breach risks $142 20-day SMA.
●$161.45: 10-day high resistance; gamma flip at $160 calls.
●$142.83 (Pivot): Key support; 20-day SMA confluence, high short liquidity.
SHORT-TERM OUTLOOK::
Bullish bias for the next 1-5 days, targeting $155-$158 retest, driven by call sweep momentum, dark pool accumulation, and bull flag setup. Watch for $153.85 reclaim Monday; volume >1x average confirms. Downside capped at $148 liquidity grab before reversal, with RSI neutrality and low ADX supporting rangebound grind higher. Risk of chop if gamma pins at $152.50, but net flow favors 3-5% upside into March 20 OPEX
JOIN THE WAITLIST ASKIDOJO.AI/LAUNCH April 18th Coming Soon!!!!!!!
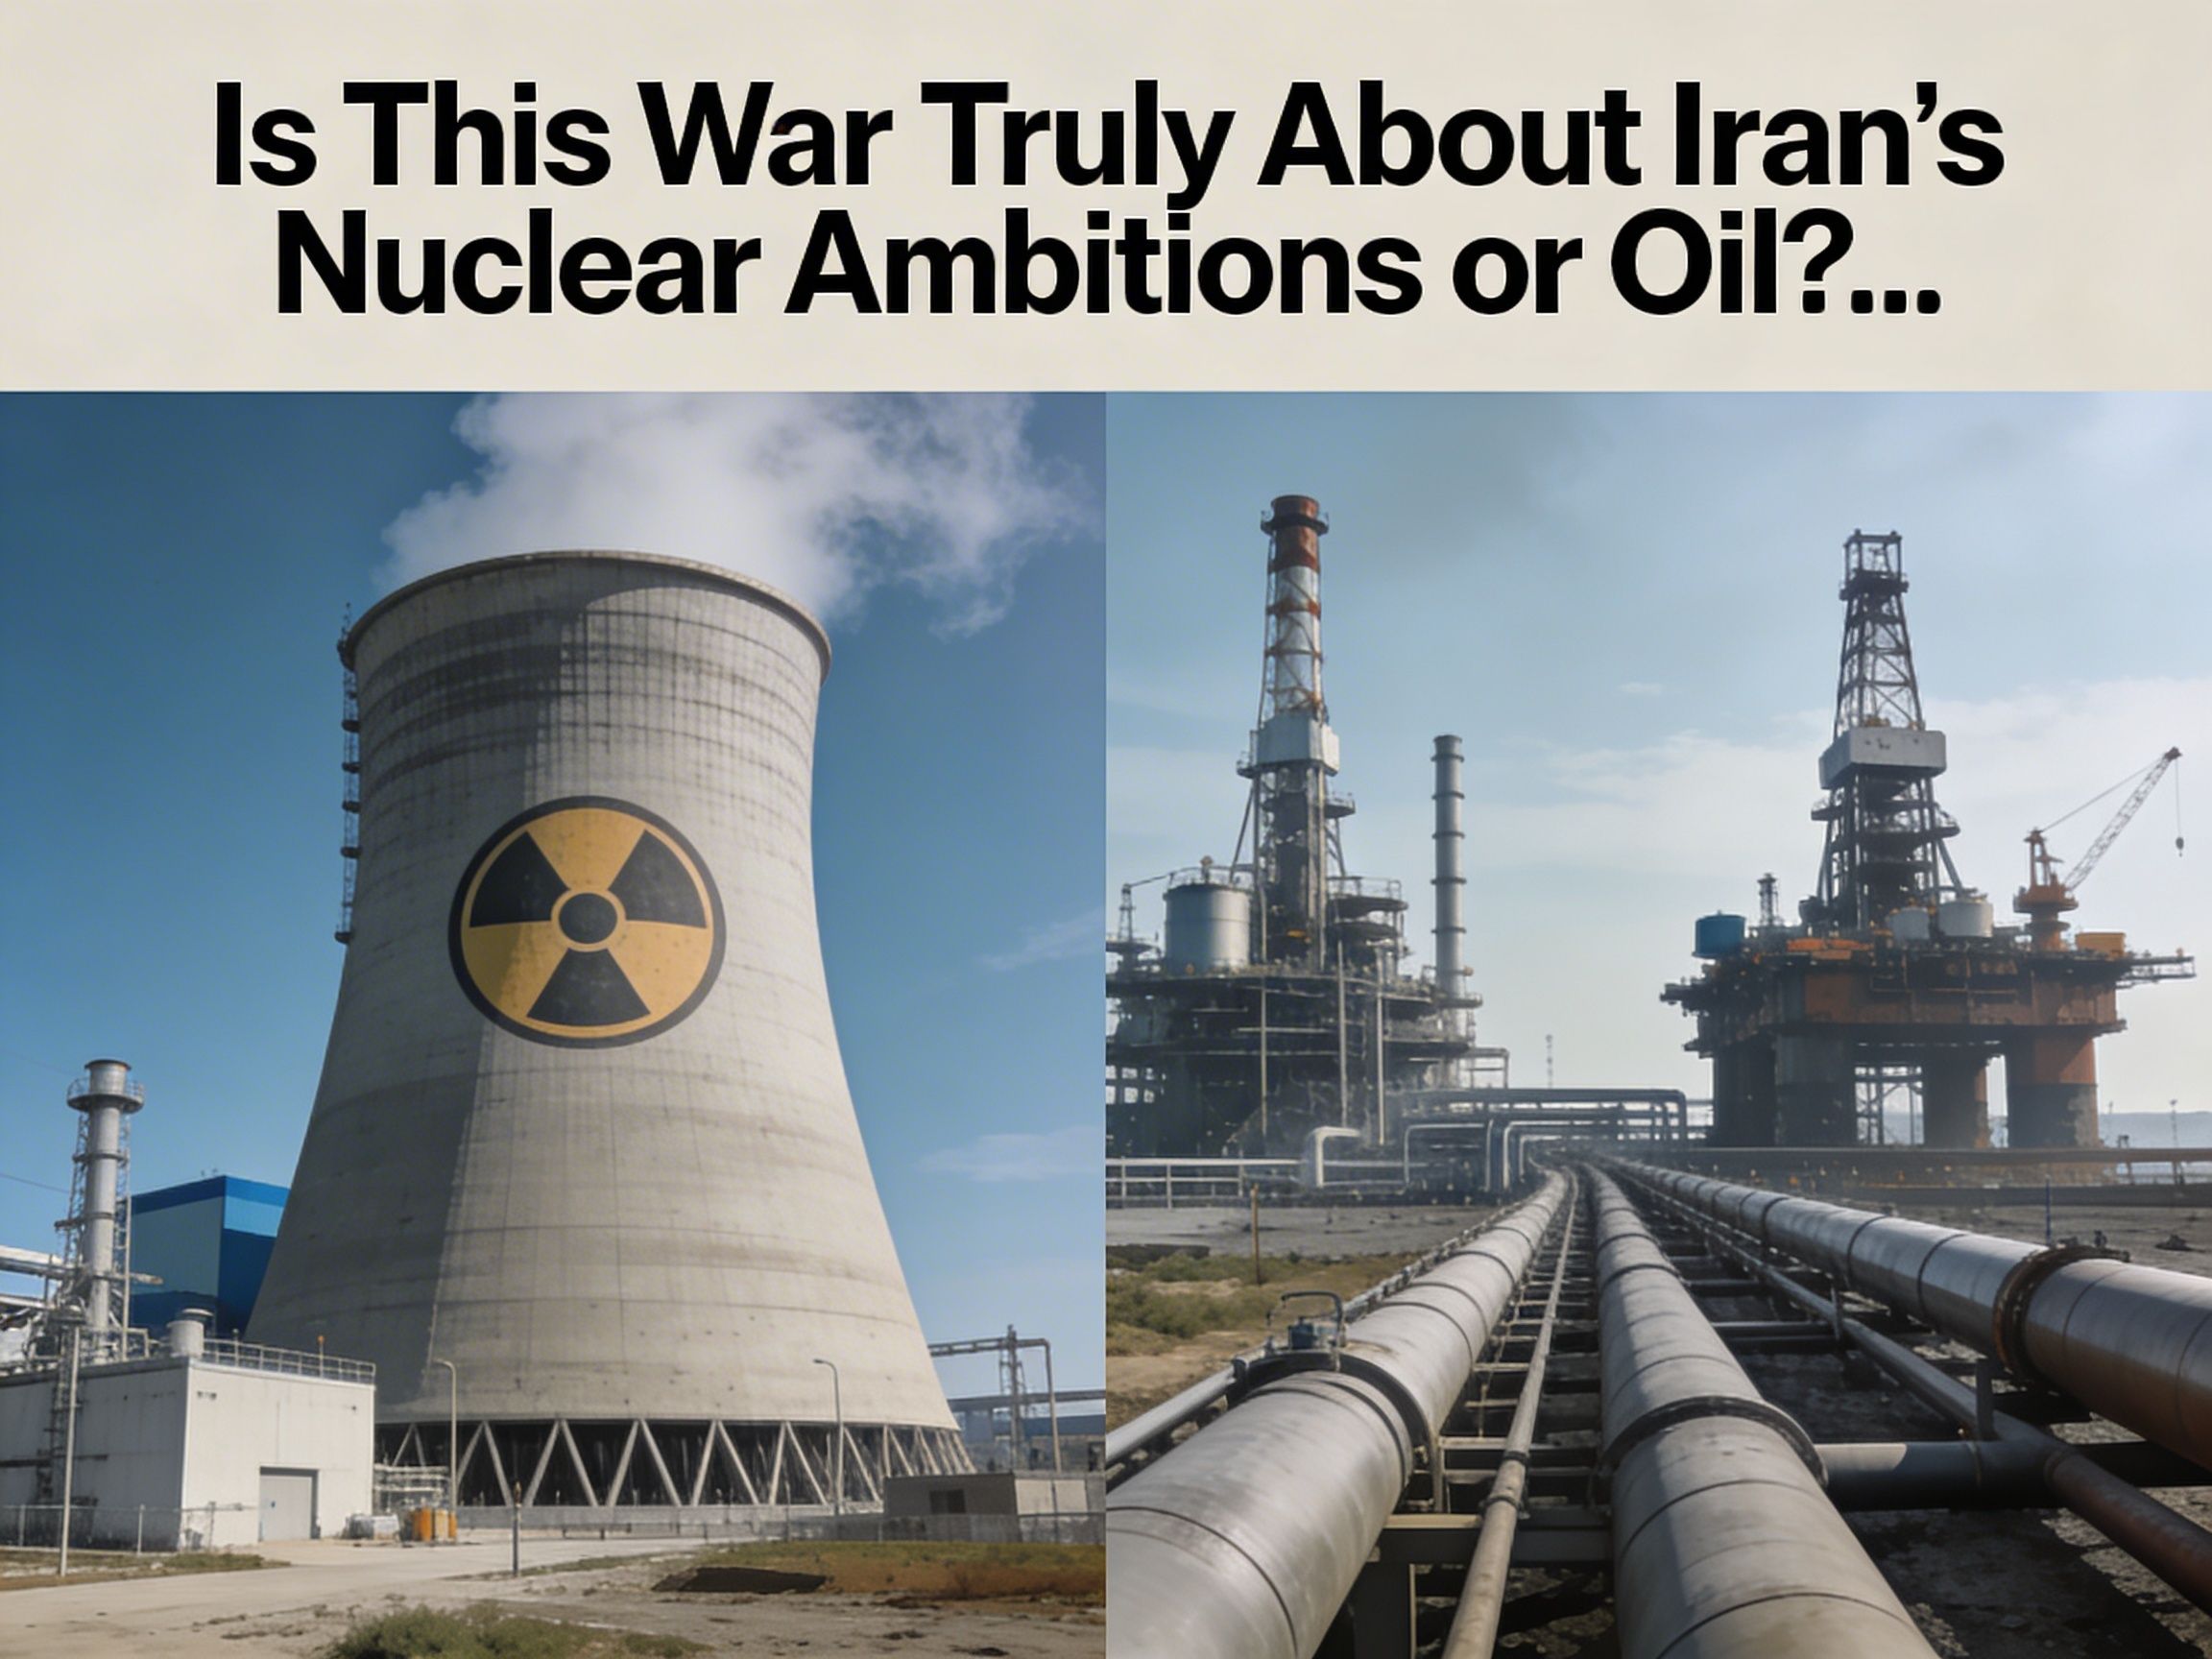
Is This War Truly About Irans Nuclear Ambitions or Oil?….
Imagine if The Onion (the American satirical news outlet) and the U.S. Energy Information Administration (EIA) had a baby in the back of a oil tanker crossing the Strait of Hormuz. That’s the energy market right now: 20 million barrels a day of oil, one‑fifth of global supply, squeezing through a sea lane that’s basically the world’s economic trachea — and half the guys with guns on shore claim God signed their deployment orders personally.
On one side, you’ve got fighters from a Muslim nation who were raised to believe that dying for what you believe is the ultimate five‑star Yelp review for your soul. On the other side, you’ve got the United States, which still wants to win wars but only if it can do it with drones, Wi‑Fi, and zero congressional hearings about body bags.
These are the spiritual heirs of the Japanese kamikaze pilots and the American focus group.
In 1944–45, Japan sent roughly 2,800–4,000 kamikaze pilots on one‑way Uber rides into Allied ships, sinking or fatally damaging more than 30 vessels. Today, the suicide mission is different: it’s the Western politician who thinks they can start a big Middle East fight in an election cycle and still have cheap gas by Labor Day.
The Strait of Hormuz is not just a place; it’s a spreadsheet bottleneck.
In 2024, about 20 million barrels per day of oil — around 20% of global petroleum liquids consumption and more than a quarter of all seaborne oil trade — squeezed through that narrow cut between Iran and Oman.
Most of that doesn’t even go to America: about 82–84% of crude and condensate through Hormuz heads to Asia, with China, India, Japan, and South Korea alone taking around two‑thirds of the flows. Meanwhile, U.S. imports via the Gulf are a rounding error: roughly 0.5 million barrels per day from Persian Gulf exporters, about 7% of U.S. crude imports and ~2% of U.S. total petroleum use.
So the U.S. goes on TV to say this is about “Iran’s nuclear ambitions,” while China quietly checks how many days of Hormuz‑risk barrels it has sitting in coastal tanks.
From one side, non‑proliferation; from another, it’s just a very nervous importer wondering if Tehran’s next press conference will double its freight bill.
Remember Russia–Ukraine? The world tried the “just open the spigot” move. In 2022, the U.S. drained about 180 million barrels from its Strategic Petroleum Reserve, and allies threw in another 60 million, to calm prices after Russia’s invasion. Treasury estimated that cocktail shaved roughly 13–31 cents per gallon off U.S. gas, maybe 17–42 cents when you add allies.
That’s helpful, but do the math: at 100 million barrels per day of global demand, 240 million barrels is basically 2.4 days of world consumption, or a couple of months of partial relief if you’re just trying to blunt the pain. Meanwhile, it takes days to schedule and load those emergency barrels and weeks for tankers to bring them to refineries.
Strategic reserves are not a new oil field; they’re a very polite “we can’t fix this but we can make it slightly less horrible for one quarter” button.
If 20 million barrels per day of flows are at risk and even a fraction gets disrupted for months, your “release the reserves” plan starts to look like trying to put out a refinery fire with a fire hose.
While your gas is expensive even when your country is oily and considering biking to Costco. You can’t help but wonder, if we are supposed to be the top producers in oil why the hell is my gas prices going up? Answer; Because oil is global — your gas station is emotionally American but financially international.
Prices are set at the margin, and the marginal barrel lives in places like the Gulf and Russia. When a narrow strait that carries 20% of global oil and around one‑fifth of LNG looks like the opening scene of a Call of Duty map, Brent spikes, and that spike bleeds into U.S. fuel, freight costs, and inflation.
Shale CEOs don’t flood the market out of patriotism; they answer to shareholders who like $85 Brent more than your summer road trip.
Meanwhile China, and Eutope are on the clock, China imports roughly 11–11.5 million barrels of crude per day, and over half of those imports come from the broader Middle East. Hormuz is not just a dot on the map for Beijing; it’s the neck artery.
Japan, South Korea, and India are in the same club:
Heavy dependence on Gulf crude and LNG that pass through the same narrow waterway.
UN and trade reports estimate that in 2024, about 20% of global LNG also crossed Hormuz, with roughly 80% headed to Asia. That means a prolonged war that makes insurers, shippers, or navies nervous doesn’t just hit “the Middle East” — it hits the electricity bill in Shanghai, Seoul, and Mumbai.
You can almost hear the central bankers prepping their favorite line: “The inflation was transitory… until geopolitics made it a lifestyle.”
Given all of this, dropping large numbers of U.S. boots on Iranian soil would be the geopolitical equivalent of lighting a match in a fireworks factory because someone looked at you funny.
Vietnam, Iraq, and Afghanistan all ended with the same three‑panel meme:
1. “We’ll be greeted as liberators,”
2. “It’s complicated,”
3. Footage of helicopters leaving rooftops.
A full ground war would:
• Detonate U.S. casualty counts and political careers.
• Make Hormuz disruption more likely, not less.
• Turbocharge oil and gas prices exactly when President Trump is heading into midterms where voters care about one number: the price on the pump sign.
So what do you get instead? Maximum tough talk — sanctions, carrier groups, red lines — followed (if they’re smart) by a sudden “historic deal” just before gas hits a number that starts trending on TikTok. It’s not strategy; it’s vibes‑based statecraft.
In one world, men are told they’re fighting for God, honor, and freedom from Western arrogance. In the other, men are told they’re defending civilization from nuclear madmen and keeping the world safe for 30‑year mortgages.
But when you rotate the picture, you see what the numbers are whispering:
• 20–21% of global petroleum liquids moving through a single strait.
• Around one‑fifth of global LNG following the same path.
• China, India, Japan, and South Korea swallowing most of it.
• Strategic reserves that can trim perhaps 13–42 cents off a gallon for a few months, not rewrite the laws of supply and demand.
The longer both sides weaponize that dependency, the more incentive China, India, and even Europe have to build a world where their energy doesn’t depend on a handful of men with missiles and midterm calendars. History says that when suppliers play games, buyers eventually redesign the game board.
History says that when suppliers play games, buyers eventually redesign the game board.
That’s the joke behind the joke: a war of two worlds, plastered with holy words and patriotic slogans, driven by very earthly pipelines and shipping lanes — and perfectly capable of ending with nobody getting what they wanted, except maybe a few energy traders and a lot of material for future satire.
WHEN INVESTING BECOMES A LIFESTYLE YOU WEAR IT!
NEW MERCH ALERT - BILL GATES BLACK - Limited Quantities - Grab Yours Today! CLICK HERE


Don't Be Liquidity Sheep...
Trump’s war drum politics might rattle screens day to day, but structurally it’s just another volatility harvest for institutions and a test of conviction for everyone else.
Trump’s stock market does not fear volatility; they weaponize it!
They need three things this year: keep the White House, keep the House, keep the Senate, and keep the market up, and right now, they risk losing all three.
• Voters still vote with their wallets; inflation, gas, and 401(k) statements are the only “political theory” most people care about.
• Midterm years and election years are historically noisy, with weaker returns and higher volatility leading up to the vote.
• Yet the 12 months after midterms have averaged mid‑teens positive returns, and the S&P 500 has not been down in the year after a midterm since 1938.
If Trump even smells a real risk of losing Congress, the war‑talk tone will pivot faster than a hedge fund after a bad quarter.
War, oil, and the fake “end of the world” Markets have “ended” dozens of times. They just keep clearing higher.
• An RBC study of 20 major geopolitical/military shock events (Vietnam escalations, Gulf War, Iraq, Afghanistan, Russia–Ukraine, even the 2025 Israel/U.S.–Iran flare‑up) found the market typically recovers its pre‑shock level in about 28 days on average.
• The big outlier was the 1973 Yom Kippur War and Arab oil embargo, where the market took years to fully recover, but even there, equities ultimately went on to hit new highs.
Oil spikes are political poison.
A sustained shutdown in flows hits not just “enemies” but friend‑emies and economically entangled partners who fund U.S. deficits and buy U.S. assets. That coalition pressure alone puts a clock on how long any serious disruption can last if Trump wants to keep power.
You don’t campaign on “Dow 22k and $7 gas” and expect to win.
History:
From 1930s Dow ~165 to Dow 50k dreams, In 1930, after the crash, the Dow closed around 165.
By 1932 it bottomed near 60, then from 1933–1937 it ripped with multiple years of 20–60% gains.
Today we sit thousands of percent higher; the Dow has crossed 35k and beyond in recent years, and a 50k print — once fantasy — is a boring extrapolation of nominal GDP and earnings growth.
Key facts that support the “markets survive war and recession” thesis:
• Since 1900 the U.S. has had roughly two dozen recessions, plus multiple major wars and conflicts.
• Despite that, long‑run annual returns for U.S. equities hover in the high single digits nominal.
• The 2010s, a decade with European debt scares, a U.S. debt ceiling circus, and U.S.–China trade war headlines, still delivered average Dow returns of about 11% per year.
No one in 2010 seriously modeled “Dow 50k,” yet the path there is simply: more people, more nominal GDP, more earnings, more nominal index levels.
The public has no appetite for another open‑ended Afghanistan or Vietnam, nor for a Congress drunk on pork and forever‑wars.
The public has no appetite for another open‑ended Afghanistan or Vietnam, nor for a Congress drunk on pork and forever‑wars.
• Inflation is inflation; whether it comes from hot wars or cold‑war fiscal bloat, it crushes real wages and turns incumbents into job seekers.
• Prolonged, unfocused conflicts plus undisciplined spending are exactly what swing voters punish when they “vote with their wallet.”
Trump is many things, but he is not blind to polling and markets.
If rising oil, sticky inflation, and drawdowns start to threaten his grip on Congress, you should expect a pre‑emptive pivot: softer war rhetoric, renewed “deal‑maker” branding, and some engineered “win” that cools geopolitical risk and calms crude back toward friendlier levels — say, the 60s — into earnings season.
Institutional money feeds on panic; they don’t fear volatility, they farm it.
• Midterm and conflict‑driven drawdowns have historically turned into attractive entry points once the dust settles.
• Since 1970, midterm years show higher volatility (median ~16% vs ~13% in other years), but the year after has delivered strong positive returns.
• Across major war and terror events, markets on average recover their pre‑shock levels within about a month.
If you’re genuinely long‑term, the cynical play is simple: treat war‑drum volatility and election‑year fear as a discount mechanism, not an apocalypse.
Don’t be the liquidity for someone else’s re‑risking.
WHEN INVESTING BECOMES A LIFESTYLE YOU WEAR IT!
NEW MERCH ALERT - BUY THE DIP NAVY - Limited Quantities - Grab Yours Today! CLICK HERE

BUY THE DIP NAVY…
Thank you for reading, we appreciate your feedback—sharing is caring.
Reply